
Last updated: June 2026 Data sources: Cornerstone Association of REALTORS, CREA, TRREB, RE/MAX, Statistics Canada
The Mississauga real estate market covers homes for sale across the city. It includes detached homes, semi-detached homes, townhouses, and condos. Prices change when more homes are listed, when fewer buyers are active, or when mortgage costs go up or down.
Buyers use market data to see what they can afford and how much they will compete with others. Sellers use it to pick a fair asking price and see what other homes are listed for.
Four numbers show the state of any housing market:
Note: These are median prices. Average prices shift each month based on which homes sell. Talk to a REALTOR for current property-specific data.

 A full cost check includes your down payment, monthly mortgage, property taxes, condo fees if any, utilities, home insurance, and a repair fund. Use a current mortgage rate and the stress-test rate to find your real borrowing limit.
Here is a simple cost template (add your own numbers):
A full cost check includes your down payment, monthly mortgage, property taxes, condo fees if any, utilities, home insurance, and a repair fund. Use a current mortgage rate and the stress-test rate to find your real borrowing limit.
Here is a simple cost template (add your own numbers):
Note: Always compare the same property type across cities for a fair picture.
- Home prices
- Active and new listings
- Completed sales
- Days on market and sale-to-list performance
LOCAL MARKET PERSPECTIVE
“Mississauga does not operate as one uniform housing market. Condominium apartments, townhouses, semi-detached homes, and detached homes can respond differently to inventory, mortgage costs, and buyer demand. I encourage clients to review comparable sales, active competition, and total ownership costs before making a buying or selling decision.”
Market Data Methodology
All figures in this article come from named sources with a reporting date. Benchmark prices and average prices are not the same thing and are labelled clearly. Year-over-year figures are used to account for seasonal patterns. No figure here is a price prediction. Check with a licensed REALTOR or the source directly for the most current data. Sources: Cornerstone Association of REALTORS / CREA, TRREB Market Watch, RE/MAX, Statistics Canada, Metrolinx.Market Snapshot (April 2026)
| Indicator | Latest Figure | Year-over-Year Change | Source and Period |
| MLS HPI Benchmark Price | $958,700 | Down 7.4% | Cornerstone / CREA, April 2026 |
| Average Sale Price (2025 full year) | $1,003,561 | Down 6% vs 2024 | RE/MAX, 2025 annual |
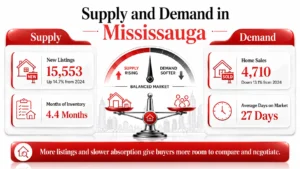
| Home Sales (2025 full year) | 4,710 | Down 13.1% vs 2024 | RE/MAX, 2025 annual |
| New Listings (2025 full year) | 15,553 | Up 14.7% vs 2024 | RE/MAX, 2025 annual |
| Months of Inventory | 4.4 months | Down from 4.9 in April 2025 | Cornerstone / CREA, April 2026 |
| Average Days on Market | 27 days | N/A | Zolo, May-June 2026 |
Understanding the Mississauga Real Estate Market
Mississauga is a top GTA housing market. It has a large number of homes, many property types, good transit links, and strong demand from buyers across the region. The market covers resale homes, condos, freehold properties, and newly built homes. Buyers range from first-time buyers to families, downsizers, and investors.What Makes Mississauga One of the GTA’s Key Housing Markets
Mississauga attracts first-time buyers because condo prices are lower than detached home prices in many GTA cities. Mississauga attracts families because detached and semi-detached homes offer more space. Mississauga attracts downsizers because it has a wide range of home types and city services already in place. The 2021 Census from Statistics Canada counted 254,089 private homes in Mississauga. Of those, 244,575 were occupied. The city had about 780,747 residents as of July 2024. Growth is expected to continue. The housing mix is about 37% single detached homes, 35% attached homes such as townhouses and semi-detached, and 27% apartment units.Why Market Conditions Change Over Time
Market conditions change because housing supply and buyer budgets do not always move together. Conditions shift when mortgage rules change, when new listings go up or down, when buyers slow down or speed up, when jobs and incomes change, when new homes are built, and when the season affects how many homes are listed. Property-type data shows where those changes show up first.Current Home Price Trends in Mississauga
Mississauga home prices are different by property type. Detached homes, semi-detached homes, townhouses, and condos each serve different buyer budgets and have different supply levels.Property Type Price Table (Q1 2026)
| Property Type | Median Price | Annual Change | Source and Period |
| Detached (single-family) | $1,250,000 | Down 9.8% | CREA, Q1 2026 |
| Semi-detached | $901,500 | Down 10.1% | CREA, Q1 2026 |
| Condo townhouse | $700,000 | Down 9.9% | CREA, Q1 2026 |
| Condo apartment | $495,000 | Down 11.6% | CREA, Q1 2026 |
Detached Home Market Trends
Detached homes are at the top of Mississauga’s property-type price ladder. They offer private land, more space, and fewer units than condo buildings. The median detached home price was $1,250,000 in Q1 2026, down 9.8% year-over-year (CREA). In April 2025, detached homes averaged $1,440,838 per sale with 180 sales and 609 new listings that month (TRREB via Condomonk). By September 2025, the average was around $1.38 million (Phinney Real Estate). Detached prices have dropped the most of any property type. More listings mean buyers have more options and can push back on price more than in past years.Semi-Detached Home Market Trends
Semi-detached homes sit between detached homes and townhouses in price. They offer ground-level living and more space than most condos at a lower cost than detached. The median semi-detached price was $901,500 in Q1 2026, down 10.1% year-over-year (CREA). In April 2025, 65 semi-detached homes sold at an average of $985,461 with 174 new listings (TRREB via Condomonk). This type has seen modest price drops but stays in steady demand. The price gap between semi-detached and detached homes makes it a popular choice for buyers who want more space without the higher cost.Townhouse Market Trends
Townhouses sit between condo apartments and detached homes. They offer more space than most condos at a lower price than a detached home. The median condo townhouse price was $700,000 in Q1 2026, down 9.9% year-over-year (CREA). All townhouse types averaged around $940,000 as of September 2025 (Phinney Real Estate). There are two main types of townhouses. Freehold townhouses have no monthly fees but the owner pays for all repairs. Condo townhouses charge monthly fees for shared area upkeep. These fees add to the total monthly cost and must be factored into your budget.Condominium Market Trends
Condo apartments offer the lowest entry price in Mississauga. Buyers must look at the purchase price, monthly condo fees, unit size, and building condition together. The median condo apartment price was $495,000 in Q1 2026, down 11.6% year-over-year (CREA). In April 2025, 136 condos sold at an average of $549,790 with 494 new listings and 880 active units (TRREB via Condomonk). Condo inventory is up, giving buyers more options and more room to negotiate. Monthly condo fees vary by building and must be included in any cost check. Price changes are easier to read when you look at listings and sales together.Mississauga Housing Market: Supply and Demand
Supply and demand show how much power buyers and sellers each have. Active listings show how much choice buyers have. Sales show how fast that supply gets absorbed.
Housing Inventory Levels
Active listings are homes available for sale right now. New listings are homes that just came onto the market. In 2025, Mississauga had 15,553 new listings, up 14.7% from 13,562 in 2024 (RE/MAX). Active inventory at the end of April 2026 was 4.4 months of supply, down from 4.9 months in April 2025 (Cornerstone/CREA). Months of inventory = active listings divided by monthly sales. More inventory means more buyer choice. Less inventory means more buyer competition.Buyer Activity and Market Demand
Buyer activity shows up in completed sales. In 2025, total Mississauga sales were 4,710, down 13.1% from 5,417 in 2024 (RE/MAX). In April 2025 alone, 490 homes sold for a total of over $487 million (TRREB via Condomonk). Sales-to-new-listings ratio = sales divided by new listings, then multiplied by 100. When rates go up, fewer buyers can qualify. When rates drop, more buyers can enter the market. Do not use one month of data alone to label the whole market.Average Days on Market
Days on market shows how long a listing stays active before a sale. In the May-June 2026 window, the median days on market in Mississauga was 27 days (Zolo). Fewer days on the market can mean strong demand. More days can mean buyers have more choice. Price, condition, and location all affect how long a home sits on the market.Multiple Offer Activity
Multiple offers happen when more than one buyer submits an offer on the same home. This usually happens when the price is right and the home is in good condition. Sale-to-list price data shows how close final prices land to asking prices. Not all homes get competing offers. One competitive listing does not mean all listings in the city are competitive. In 2025 and early 2026, buyers will have more room to negotiate than they did in 2021 and 2022. Sale-to-list ratios have generally moved lower as more listings hit the market.Is It a Buyer’s Market or Seller’s Market in Mississauga?
Mississauga can have different conditions by property type. Condo buyers may have more options while detached home buyers face less supply and more competition.What Defines a Buyer’s Market
A buyer’s market develops when there are more homes for sale than buyers ready to purchase. Buyers get more time, more choice, and more room to ask for a lower price. Signs of a buyer’s market include higher active listings, more days on market, lower sale-to-list ratios, a lower sales-to-new-listings ratio, and price cuts on homes that do not sell quickly.What Defines a Seller’s Market
A seller’s market develops when buyers snap up listings fast, leaving less choice and more competition. Signs of a seller’s market include low inventory, fast sales, a strong sales-to-new-listings ratio, sale prices near or above asking, and multiple offers on similar homes.Key Market Indicators to Watch
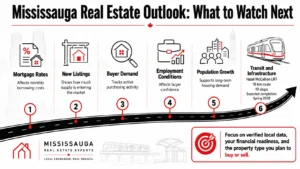
Track active listings to measure buyer choice. Track new listings to measure how much supply is coming in. Track sales to see how many buyers are closing deals. Track days on market to see how fast homes are being absorbed. Track sale-to-list ratios to see pricing pressure. Track mortgage rates to see buyer purchasing power. These signals change when borrowing costs, population, jobs, and supply levels shift.Key Factors Affecting the Mississauga Real Estate Market
Mississauga Real Estate conditions respond to affordability, population growth, jobs, housing supply, and broader economic conditions.
Interest Rates
Interest rates affect home demand because they change monthly payments, borrowing limits, and the top price many buyers can qualify for. When rates rise, the monthly cost of a mortgage goes up and buyers can afford less. When rates fall, more buyers can enter the market. The federal mortgage stress test asks buyers to qualify at a rate higher than the one they will actually pay. This lowers the maximum purchase price for many buyers.Population Growth
More people means more demand for homes to rent or buy. Mississauga had about 780,747 residents as of July 2024 (Statistics Canada). The city is expected to reach between 785,000 and 800,000 residents in 2025. Most new housing now comes from condo towers and mid-rise buildings near transit. Not every new resident will buy right away. Many rent first before buying.Employment Opportunities
Jobs support home buying because steady income helps people get a mortgage and feel confident about buying. Mississauga has a diverse economy and good links to GTA employment. Note that Ontario’s unemployment rate was 7.6% in early 2026 (Nesto/Statistics Canada). Higher unemployment can reduce buyer confidence and slow down the market.Housing Supply Constraints
When fewer homes are built than buyers need, prices can stay high or rise again. Most of Mississauga’s land for detached homes is already built out. New supply now comes mostly from condo towers and buildings near transit corridors. Long approval times, construction costs, and builder capacity all affect how fast new homes reach the market.Economic Conditions
The broader economy affects home buying through inflation, wage growth, confidence, and household debt. Mortgage delinquencies in Toronto have risen in early 2026 and Ontario now makes up a growing share of national unemployment (Nesto). These pressures can make buyers more cautious. Watch economic signals alongside local housing data before making a move.Real Estate Market Opportunities for Home Buyers
Buyers get the best results when they match their budget, loan capacity, and housing needs to current market conditions before making an offer.Evaluating Affordability
You can check affordability by looking at the full cost of owning a home, not just the purchase price.
A full cost check includes your down payment, monthly mortgage, property taxes, condo fees if any, utilities, home insurance, and a repair fund. Use a current mortgage rate and the stress-test rate to find your real borrowing limit.
Here is a simple cost template (add your own numbers):
| Cost Item | Monthly Estimate |
| Mortgage payment | $[based on price and rate] |
| Property taxes | $[local rate x value / 12] |
| Condo fee (if applicable) | $[from listing] |
| Utilities | $[estimate] |
| Home insurance | $[quote] |
| Repair fund | $[1% of home value per year / 12] |
| Total monthly cost | $[total] |
Understanding Market Timing
Base your timing on your finances and housing needs, not on a guess about which way prices will move. Watch new listings to see how much supply is coming. Check recent sold prices to see what homes are actually going for. Follow mortgage rate changes to see how costs are shifting. Look at days on market and inventory for your chosen property type.Assessing Long-Term Property Value
Long-term value depends on property condition, total ownership costs, resale appeal, supply, and buyer demand over time. Think about property type, layout, repair needs, monthly costs, and future resale demand. Confirmed changes to transit or employment can affect demand in an area over time.What Home Sellers Should Know About Current Market Conditions
Sellers need a pricing plan that reflects what buyers are paying right now, what is listed nearby, and the condition of the home.Pricing Based on Market Reality
A good asking price is based on recently sold homes, active listings, property condition, and current inventory for the same property type. Compare homes that sold recently with homes that are still listed and homes where the listing expired. Factor in age, size, condition, and whether the home is freehold or condo. A price above recently sold homes will likely sit on the market longer.Preparing for Buyer Expectations
Buyers today look at condition, price, monthly costs, and clear listing details before making a buying offer. Fix needed repairs before listing. Declutter the space. Use good photos. Provide accurate details. Have maintenance records ready. Complete all required disclosures.Understanding Competition
Competition among sellers goes up when similar homes list at similar prices. Watch nearby active listings, look for price drops on similar homes, and note how long those homes stay listed. Buyer feedback from showings can tell you if your price is off.Mississauga Real Estate Market Compared to Other GTA Cities
Mississauga should be compared with nearby cities using the same property type, the same price measure, and the same reporting period.GTA City Comparison Table (Q1 2026, Median Prices, CREA)
| City | Detached Median | Semi-Detached Median | Condo Apt Median | Key Context |
| Mississauga | $1,250,000 | $901,500 | $495,000 | Established city, mixed supply |
| Toronto | Higher for detached | Varies | ~$717,210 avg (Q2 2025, TRREB) | Largest condo supply in GTA |
| Brampton | Lower than Mississauga | Similar to Mississauga | Lower condo supply | More family-sized freehold homes |
| Oakville | Higher than Mississauga | Premium segment | Small condo supply | Premium market |
| Milton | Newer builds at lower prices | Limited supply | Small condo segment | Commuter demand, newer stock |
Mississauga vs Toronto
Mississauga and Toronto differ in housing mix, price, condo supply, and density. Toronto has a much larger condo market. Detached homes in Mississauga have generally cost less than similar Toronto homes. For condos, prices in both cities can be close, depending on location and building. Always compare the same property type using the same reporting month.Mississauga vs Brampton
Brampton has historically had lower prices for detached and semi-detached homes than Mississauga. Brampton’s stock leans toward larger family homes. Compare total ownership costs, not just the purchase price.Mississauga vs Oakville
Oakville detached homes generally cost more than Mississauga detached homes. Oakville’s condo segment is smaller. Supply and competition differ between the two cities by property type.Mississauga vs Milton
Milton has more new builds and entry-level detached homes at lower prices than Mississauga. Mississauga offers a larger resale market, more established services, and more property type options. Model the actual mortgage payments for each city before comparing. The comparison shows why Mississauga’s future market depends on both local activity and GTA-wide housing pressure.Future Outlook for the Mississauga Real Estate Market
The Mississauga outlook depends on population growth, new home completions, mortgage costs, job conditions, and the balance between listings and sales. Future prices cannot be predicted with certainty. Use verified data and speak with a REALTOR before making plans.
Population and Housing Demand
More people and more households can increase long-term housing demand. Mississauga’s population is expected to be between 785,000 and 800,000 in 2025. New housing is mostly coming from condo towers and mixed-use projects near transit. RE/MAX projected sales to rise 7% in 2026 versus 2025 and average prices to increase about 3% going into 2026 (RE/MAX Mississauga Outlook, January 2026). These are projections, not promises.Infrastructure Development
Confirmed transit and road projects can raise housing demand near the route. The Hazel McCallion LRT is under construction. Metrolinx expects construction to reach completion in spring 2028 (April 2026). The line will run 18 kilometres with 19 stops between Port Credit and Steeles Avenue. A first LRT vehicle moved under its own power in May 2026, a key project milestone (INsauga, May 2026). When open, the line is expected to carry about 32 million riders per year by year three of service.Market Factors to Monitor
Watch mortgage rates to track financing conditions. Watch new listings to track incoming supply. Watch sales to track buyer activity. Watch active listings to track available choices. Watch employment data to track household confidence. Watch housing completions to track new supply.Frequently Asked Questions About the Mississauga Real Estate Market
Are home prices increasing in Mississauga?
As of Q1 2026, prices are down across all property types year-over-year. The MLS HPI benchmark was $958,700 in April 2026, down 7.4% from April 2025 (Cornerstone/CREA). Detached and condo prices have dropped the most. Check each property type on its own since each moves at a different rate.Is Mississauga a buyer’s market or seller’s market?
As of early 2026, conditions lean toward buyers. Inventory rose sharply in 2025, sales fell, and prices are down year-over-year. RE/MAX described it as a buyer’s market going into 2026. That said, conditions vary by property type. Look at active listings, sales, the sales-to-new-listings ratio, days on market, and sale-to-list ratios before drawing any conclusions.Which property type is most in demand?
In April 2025, detached homes had the most sales at 180, followed by condo apartments at 136 (TRREB via Condomonk). But demand must be read alongside supply. Condos had 880 active units versus 849 for detached, pointing to different absorption rates. Compare sales, listings, days on market, and sale-to-list ratios across all types for the clearest picture.Is Mississauga a good place to buy real estate?
Mississauga offers access to GTA jobs, many home types, and established city services. A purchase decision should match your budget, ownership timeline, housing needs, and current supply-demand conditions for your chosen property type. Verify current data with a REALTOR before deciding.What factors influence property values in Mississauga?
Mississauga property values respond to mortgage rates, housing supply, buyer demand, property condition, home type, jobs, population growth, and confirmed infrastructure changes. Recent comparable sales give the strongest local evidence for what a specific home is worth right now.Final Thoughts on the Mississauga Real Estate Market
The Mississauga real estate market is not one single market. Detached homes, semi-detached homes, townhouses, and condos each respond differently to listings, buyer demand, and borrowing costs. Use this five-step plan before buying or selling:- Check current prices for your property type.
- Look at listings, sales, and days on market.
- Work out your mortgage costs and total monthly ownership costs.
- Compare recently sold homes with homes currently for sale.
- Make decisions using local verified data, not general headlines.